What jetson_clocks survives: stress-testing a 100 Hz loop on Jetson Orin
This is the last post in a short series on real-time inference latency on a Jetson Orin Nano Super. The first two established a problem and its cause:
- Part 1: running MobileNetV2 at a real 100 Hz period is 62% slower than the back-to-back benchmark.
- Part 2: the cause
is dynamic clocking (DVFS) — GPU-dominant, with a CPU interaction — and
jetson_clocksrecovers a deterministic ~3.9 ms.
That left the obvious question for anyone deploying this: a robot’s board is never idle. Does system load break the deadline? With a caveat I’ll be explicit about up front — this is a light model with a lot of slack, run in a cool room — the answer here is no, and it closes the series cleanly.
The setup
Same board and harness (100 Hz, 100k cycles, SCHED_FIFO prio 80 on a dedicated
core), clocks pinned with jetson_clocks — the deploy state Parts 1–2 argued
for. On top of that I ran a stress matrix with stress-ng: CPU, memory
bandwidth, last-level cache, IO, and timer/IRQ pressure, individually and in
combination. Then I pushed each axis harder — memory bandwidth swept up to 8
STREAM workers, cache thrashed, an IRQ storm, and a combined profile loading
CPU + memory + cache + IO together.
One thing this is not: a second GPU workload. There’s a single inference stream and the stressors hammer CPU-side shared resources around it. A real robot usually has competing CUDA kernels, NVDEC/VIC, camera/ISP, and a ROS2/DDS stack contending for the GPU too — that’s a different and harder test, and it’s not this one.
Inference runs at real-time priority on its own core, so stressors can’t steal its CPU time directly; what they can do is contend for shared resources — memory bandwidth, cache, the interrupt path. That’s the contention this measures.
The result: nothing reached the deadline
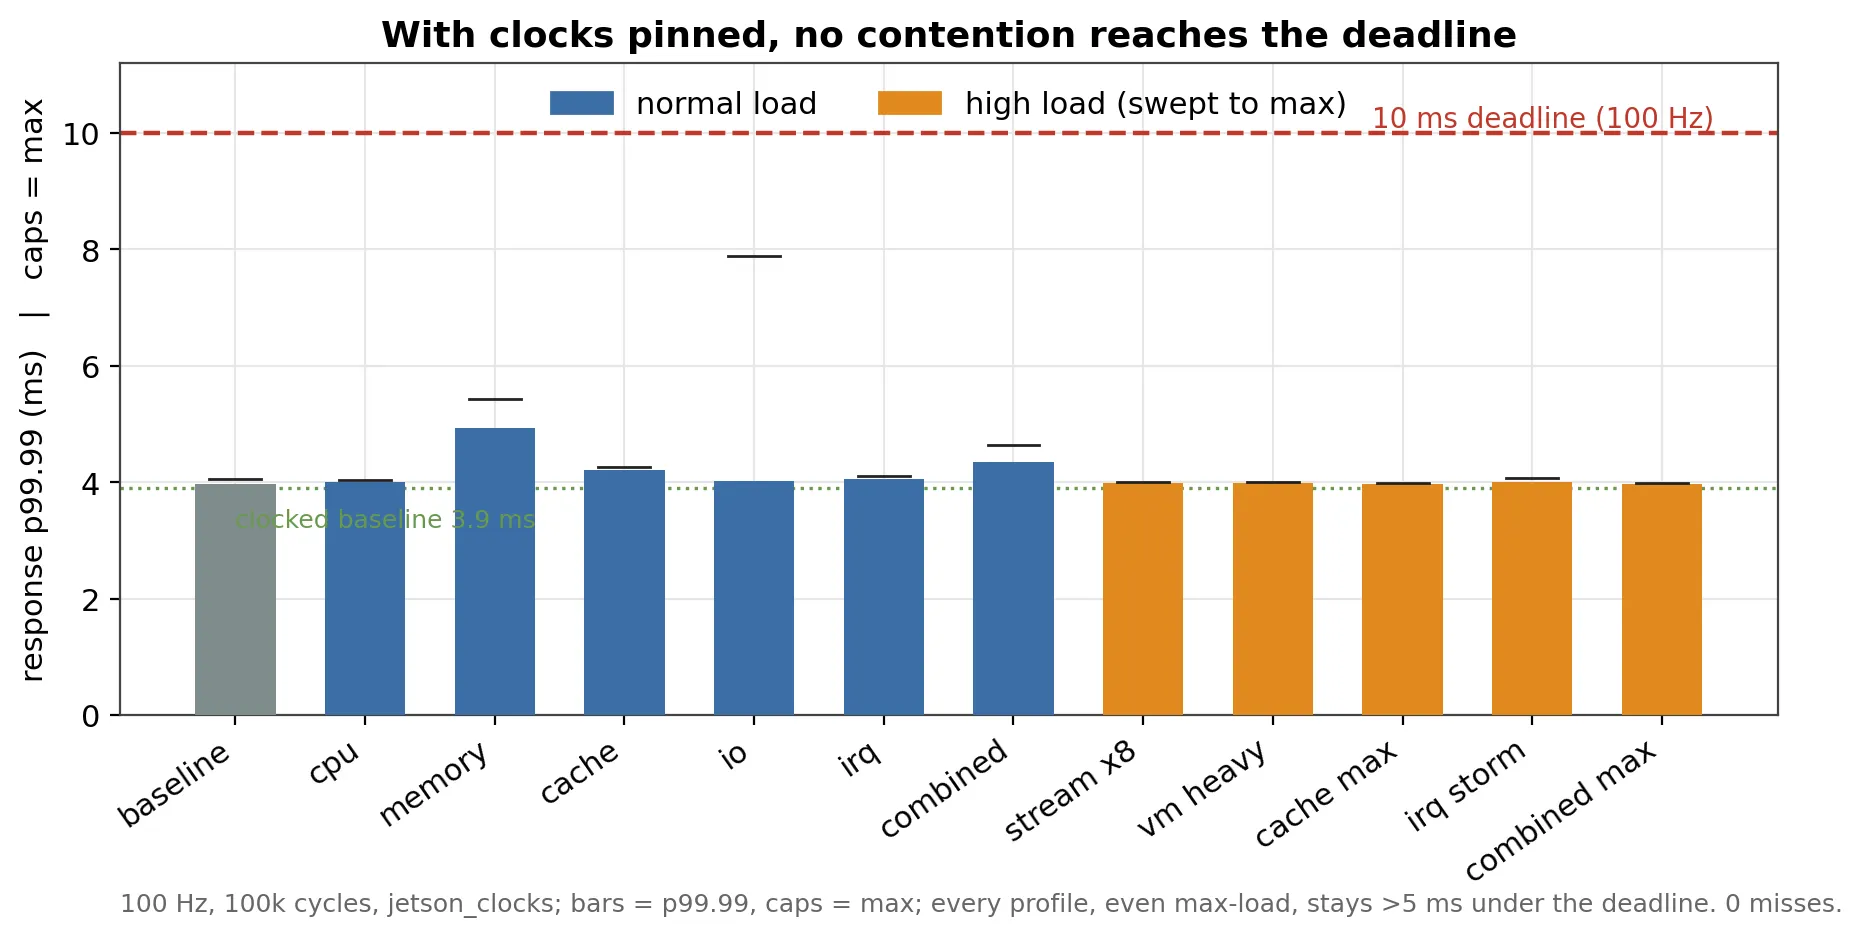
Every profile, across 100,000 cycles each, stayed under 5 ms p99.99 against a 10 ms deadline — zero misses, in every case.
| profile | resp p99.99 | resp max | misses |
|---|---|---|---|
| baseline (clocked, no load) | 3.97 ms | 4.06 ms | 0 |
| CPU ×6 | 4.01 ms | 4.05 ms | 0 |
| memory (vm) | 4.93 ms | 5.43 ms | 0 |
| cache | 4.22 ms | 4.26 ms | 0 |
| IO | 4.02 ms | 7.89 ms | 0 |
| IRQ/timer | 4.06 ms | 4.11 ms | 0 |
| combined | 4.35 ms | 4.65 ms | 0 |
| memory bandwidth ×8 (STREAM) | 3.99 ms | 4.01 ms | 0 |
| cache thrashed | 3.98 ms | 3.99 ms | 0 |
| IRQ storm | 4.01 ms | 4.08 ms | 0 |
| combined: CPU+mem+cache+IO | 3.98 ms | 3.99 ms | 0 |
The memory-bandwidth sweep is the most striking line: 2 → 4 → 6 → 8 STREAM workers, and p99.99 didn’t move — 3.96, 4.00, 3.98, 3.99 ms. I didn’t measure actual DRAM throughput, so I won’t claim the bus was saturated; what I can say is that under this STREAM load, with the clock already pinned at max, there was no measurable slowdown. The worst single spike anywhere was a one-off 7.9 ms during IO stress — still 2 ms under deadline.
A useful contrast: in earlier testing without pinned clocks, cache contention alone produced deadline misses. With clocks pinned, the same cache stress was invisible. In this regime the misses tracked the governor, not the load.
Three layers, all holding
Why is it this robust? Three independent mechanisms each close one door:
SCHED_FIFOon a dedicated core neutralizes CPU contention — the CPU-stress profiles look identical to baseline.- Pinned clocks mean memory and cache contention can’t translate into a cold, downclocked pipeline; the hardware is already at full speed.
PREEMPT_RTkeeps release jitter at ~22 µs even under an IRQ storm.
Remove any one — most easily, the clocks — and the latency moves. Together, they leave contention with nowhere to land.
The series, in one line
Across three posts: at the edge, the variable that dominated worst-case inference latency here was the clock governor, not system load. Left dynamic, a 100 Hz loop runs 62% slow even on an idle board (Part 1), because the GPU and CPU clock down in the gaps (Part 2). Pin the clocks and — for this light model, with ~6 ms of slack, in a cool room, against CPU-side stress — the loop absorbed memory, cache, and IRQ pressure without missing a deadline (Part 3).
The practical takeaway is narrow but useful: for periodic inference on a
deadline, turn on jetson_clocks first. On this kind of workload it bought
more than isolating load did. Whether that holds for a heavier model, a hot
enclosure, or a GPU shared with other tasks is exactly what this didn’t test.
Scope, and what I didn’t test
One board, one model, one kernel — and the conditions were forgiving on purpose and by accident. The model is light: MobileNetV2 sits at ~3.9 ms against a 10 ms deadline, so it starts with ~6 ms of slack, and it’s not surprising that CPU-side stress doesn’t eat through that. It ran in a climate-controlled server room; even maxed out the SoC stayed well below throttling, but that owes something to the cool ambient. In a warm enclosure — a robot chassis, an outdoor cabinet, a fanless box — the same load would start hotter and could reach throttling, at which point the clocks I pinned get pulled down by hardware anyway. And each profile ran once, in a fixed order, so run-to-run variance and order/thermal-accumulation effects aren’t separated out.
So the honest scope is narrow: this model, on this board, in a cool room,
under these stress-ng profiles, with no competing GPU work, held a 100 Hz
deadline with clocks pinned. A heavier network with a thinner margin, a hot
enclosure, or a shared GPU could each change the answer. Those are outside what I
tested. This series ends here.
Code, raw 100k-cycle results, and tegrastats traces for all three parts: github.com/dankang21/jetson-latency-lab