It wasn't just the GPU: decomposing the 100 Hz inference penalty on Jetson Orin
In Part 1 I
measured that running MobileNetV2 at a real 100 Hz period costs 62% over the
back-to-back number, and I wrote that the penalty was “entirely in the GPU.” A
reader pushed back, correctly: jetson_clocks does not just pin the GPU — it
pins CPU, GPU, and EMC (memory) together. So “I locked the clocks and it got
faster” does not prove the GPU was the culprit. It proves some clock domain
was.
This post settles it by fixing one domain at a time, and by logging the clocks during the run instead of inferring them. The short version: the GPU is most of it, but not all of it, and the worst-case tail is a separate story that the GPU alone does not fix.
The setup
Same board and harness as Part 1 (Jetson Orin Nano Super, PREEMPT_RT,
MobileNetV2-12 ONNX on the CUDA EP, 100 Hz, 100,000 cycles, SCHED_FIFO on a
dedicated core). The change is clock control. Instead of jetson_clocks
(all-or-nothing), I fix each domain independently by writing its sysfs
min/max frequency, leaving the others dynamic:
- free — everything dynamic (the natural deploy state)
- gpu_only — GPU pinned to max, CPU dynamic
- cpu_only — CPU pinned to max, GPU dynamic
- all — both pinned (reproduces
jetson_clocks; EMC left dynamic)
And during every run, tegrastats logs the actual CPU/GPU/EMC clock, temperature,
and power every 50 ms, so the cause is observed, not assumed.
Evidence first: the GPU ran at half clock
Before decomposing anything, here is what the GPU actually did during the free run — the thing Part 1 could only infer:
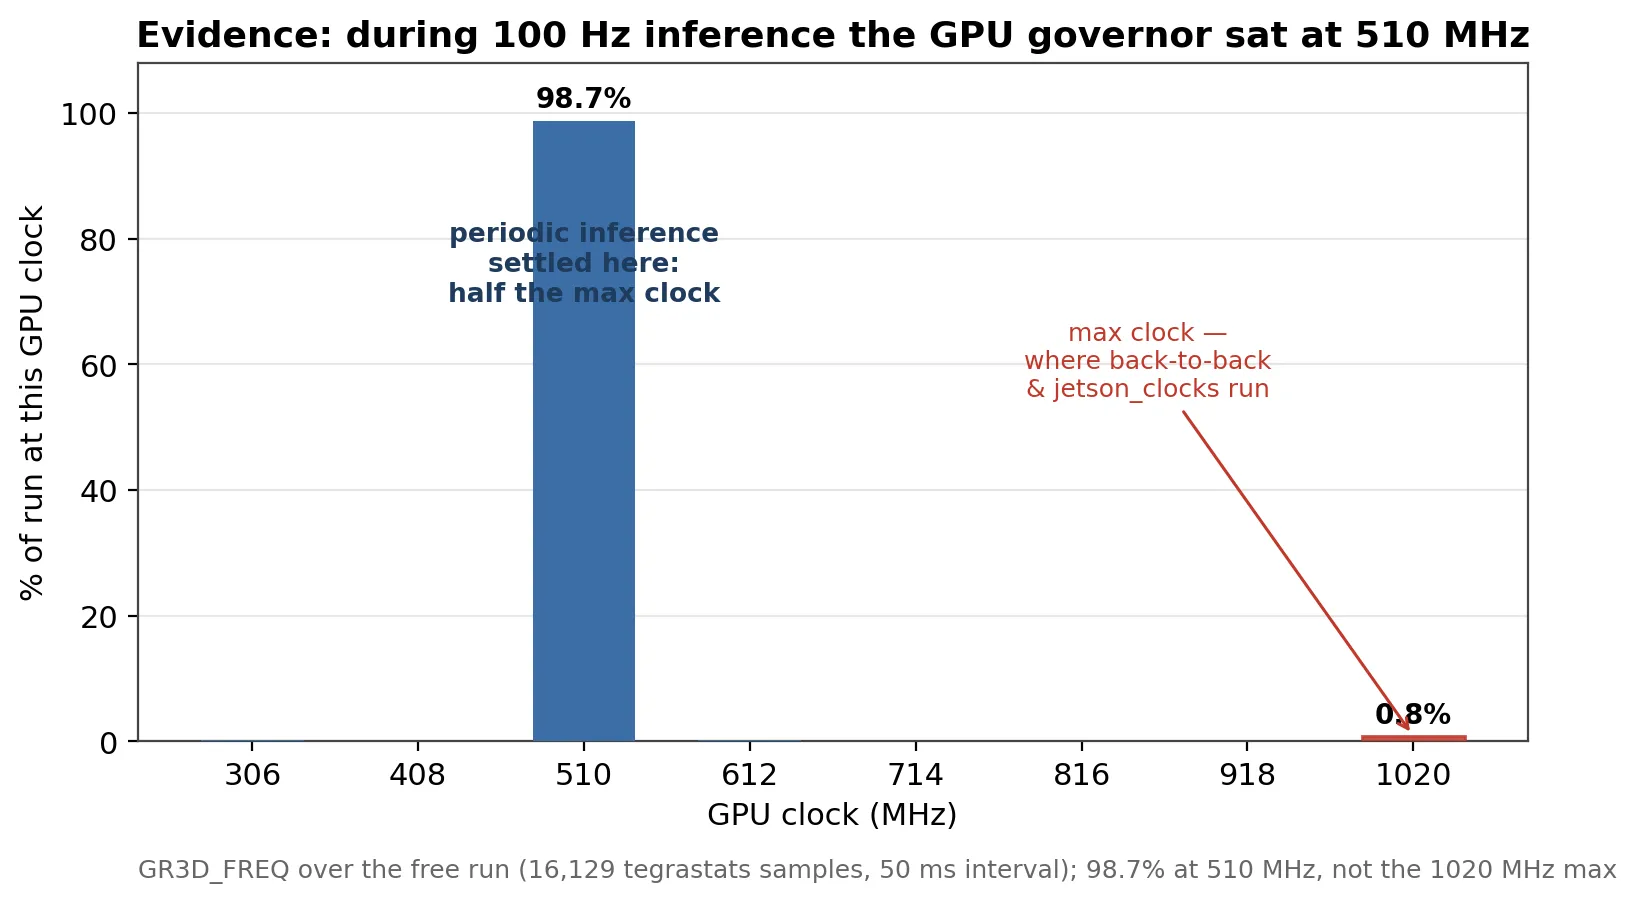
For 98.7% of the run the GPU sat at 510 MHz — exactly half its 1020 MHz max. Not throttling, not contention: the governor simply saw ~6 ms of idle every 10 ms cycle and decided the load was light. Back-to-back keeps the GPU busy enough to stay near max; periodic inference does not. That is the mechanism, now on the record rather than assumed.
One detail worth noting: half the clock did not mean double the latency. Compute went from 3.89 ms (max clock) to 6.88 ms (510 MHz) — 1.77×, not 2×. Inference time is not purely clock-bound; a fixed cost per call (kernel launches, host/device transfer) does not scale with frequency.
Decomposing the penalty
If the GPU clock were the whole story, pinning it should fully recover the back-to-back latency. It does not.
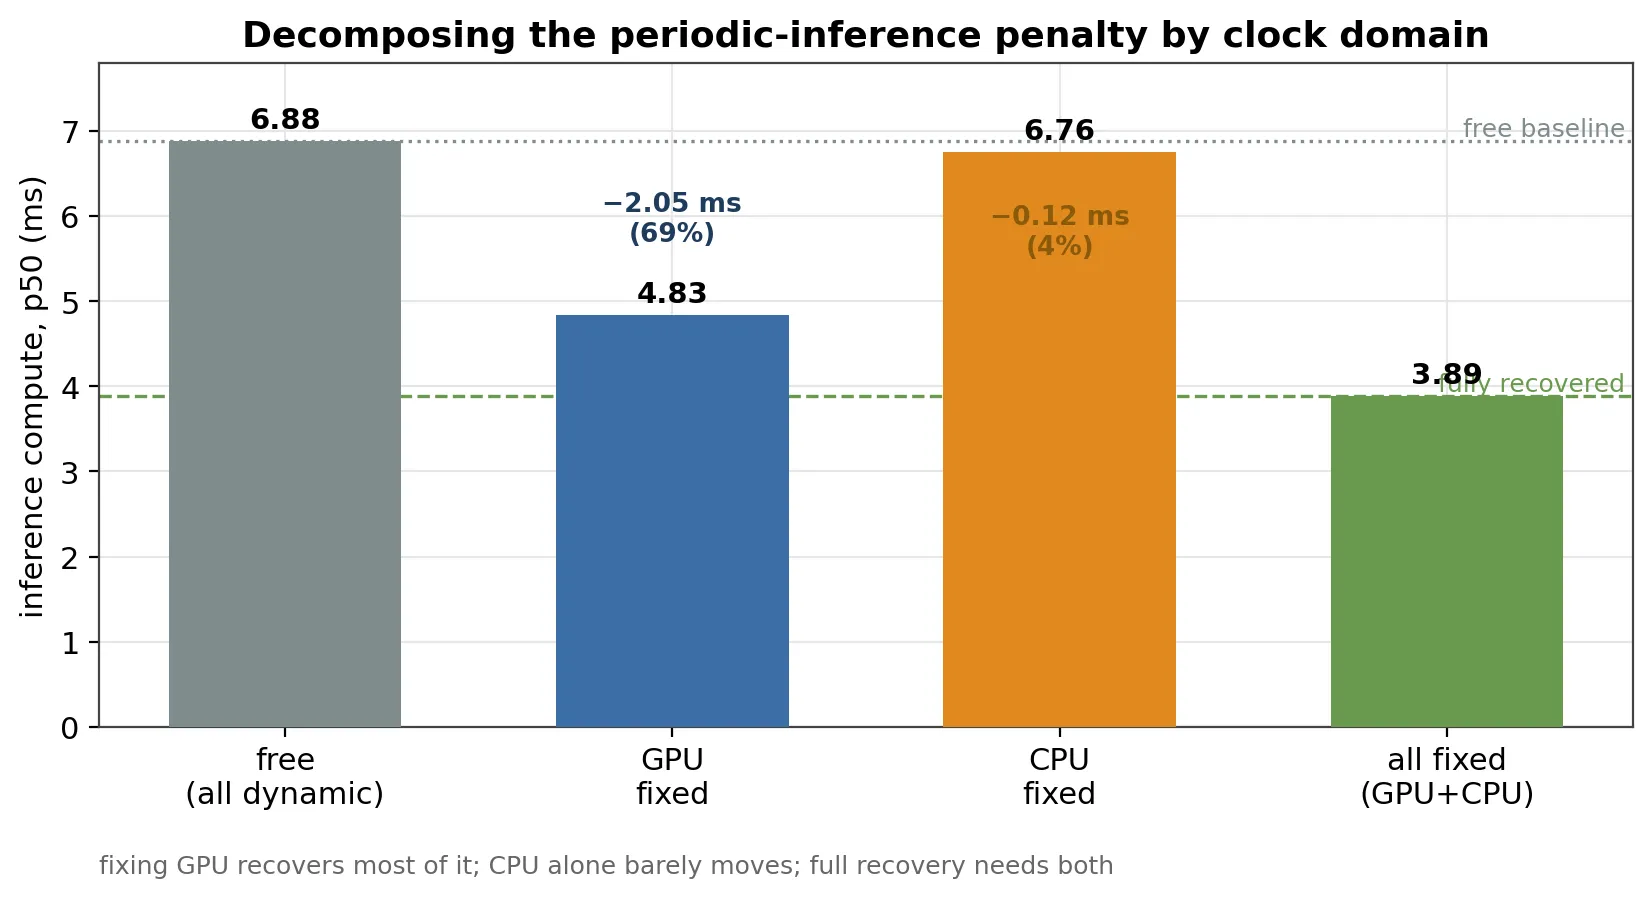
Reading compute p50 against the free baseline (6.88 ms) and full recovery (3.89 ms):
| profile | compute p50 | recovered | share of penalty |
|---|---|---|---|
| free | 6.88 ms | — | — |
| GPU fixed | 4.83 ms | 2.05 ms | ~69% |
| CPU fixed | 6.76 ms | 0.12 ms | ~4% |
| both fixed | 3.89 ms | 2.99 ms | 100% |
The arithmetic is the interesting part. GPU alone recovers 2.05 ms and CPU alone recovers 0.12 ms — that sums to 2.17 ms. But fixing both recovers 2.99 ms. The missing ~0.8 ms (about 27% of the penalty) only appears when both domains are pinned together. It is an interaction: the inference pipeline is not just GPU math, it is GPU math plus CPU-side host work — dispatch, input/output handling, the shape ops ONNX Runtime keeps on the CPU. When the GPU is fast but the CPU is idling down between cycles, that host-side work stretches, and vice versa. Neither domain alone is the bottleneck; the cold pipeline is.
So Part 1 was directionally right and overstated. The GPU dominates (~69%), but “entirely in the GPU” was wrong. The honest statement is: the periodic penalty is GPU-dominant, with a real CPU/pipeline interaction term.
The tail tells a different story
Median latency is one thing; the worst case a control loop has to survive is another. Looking at the spread from p50 to p99.99:
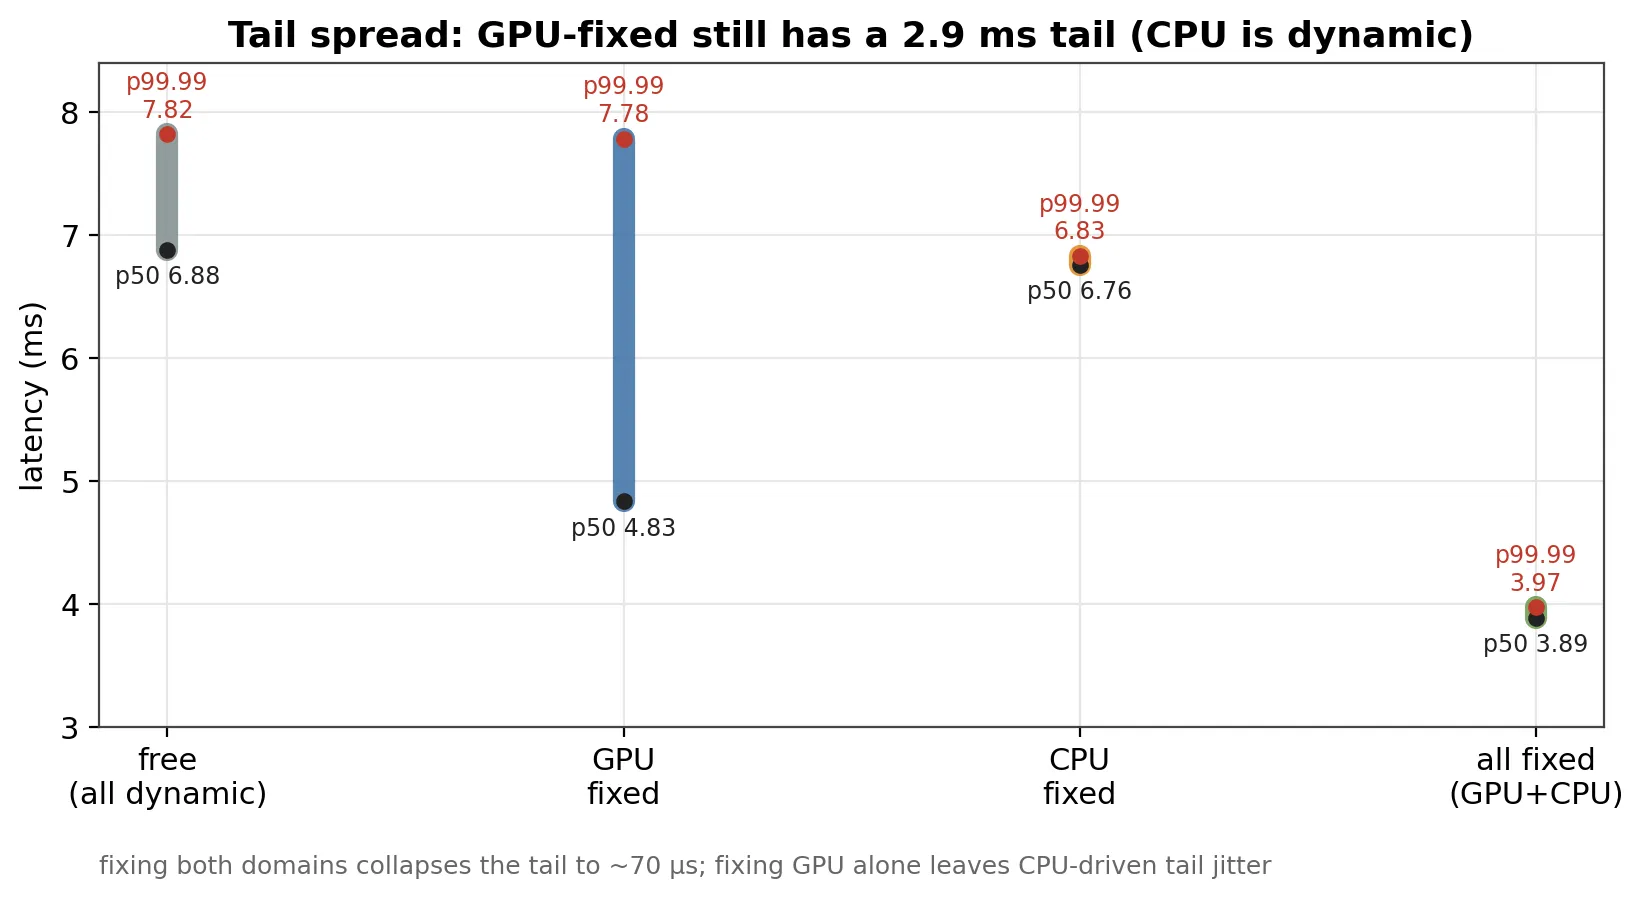
all and cpu_only are tight — about 70 µs from p50 to p99.99. But gpu_only,
with the GPU pinned, still has a tail that reaches 7.78 ms from a 4.83 ms
median — a 2.9 ms spread. Pinning the GPU fixed the median but not the tail,
because the CPU was still free to clock down. The worst-case jitter rides on the
domain you left dynamic.
The practical reading: if you care about average throughput, fixing the GPU clock buys you most of it. If you care about deterministic worst-case latency — which is the whole point of running on a real-time kernel — you need the CPU pinned too.
EMC is not the culprit
The reader’s specific worry was memory: maybe it is EMC, not GPU. The trace answers directly. EMC sat at the same frequency (3199, per tegrastats) across all four profiles, while compute p50 moved from 6.88 ms to 3.89 ms. Same memory clock, very different latency — so the memory domain is not where this penalty lives. It is GPU and CPU.
Takeaways
- The periodic-inference penalty is GPU-dominant (~69%) but not GPU-only. About a quarter of it is a GPU↔CPU pipeline interaction that only resolves when both clocks are up. EMC plays no role here.
- Median and tail need different fixes. GPU pinning recovers the median; the worst-case tail needs the CPU pinned as well. On a deadline-driven system, pin both.
- Log the clocks, don’t infer them. The 510 MHz finding is the difference between “the GPU probably downclocked” and showing that it did, for 98.7% of the run.
Correction to Part 1
Part 1 said the penalty was “entirely in the GPU.” That was an overstatement made without per-domain isolation. With it, the penalty is GPU-dominant but includes a CPU/pipeline interaction term. The Part 1 numbers stand; the attribution is refined here.
Scope and reproduce
One board, one model, one kernel, one governor. The mechanism (idle gap → governor downclock → cold pipeline) generalizes; the 69/4/27 split will not. Code, raw 100k results, and tegrastats traces: jetson-latency-lab.
sudo PY=$(which python3) MODEL=models/mobilenetv2-12.onnx \
  CPU=5 ITERS=100000 INTERVAL_MS=50 ./part2/run_part2.sh
python3 part2/analyze_part2.py